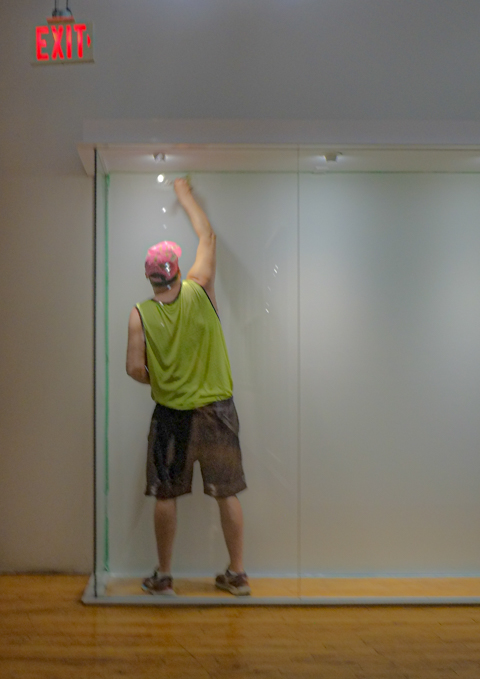
… a few selections from what is/was on view at 401 Richmond last week. Some of these exhibits were in their last days and may no longer be viewed.
below: A Space Gallery, Jason Bearg, ” aen nistwayr mayshkotoonikayhk/First Story” (until 11 July 2026) large, round, illuminated artworks cover one wall of the gallery.
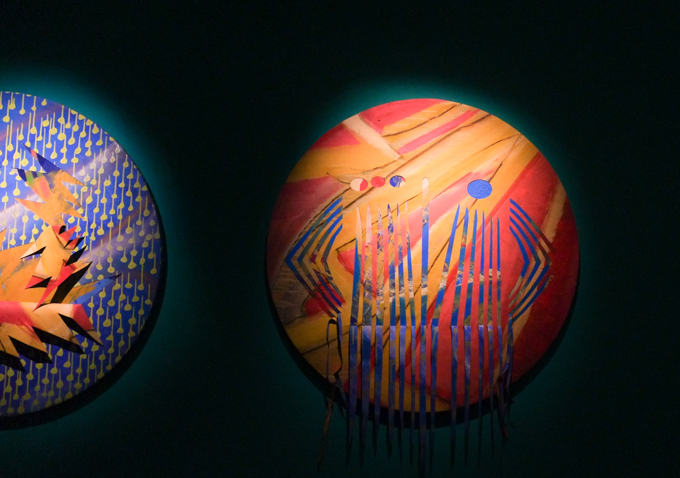
below: More Jason Baerg – this is part of a larger piece.
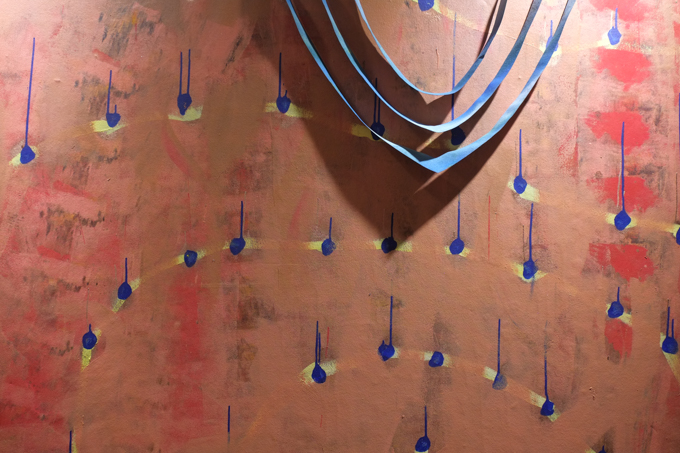
A Space hallway windows, Alaa Al-Shawa
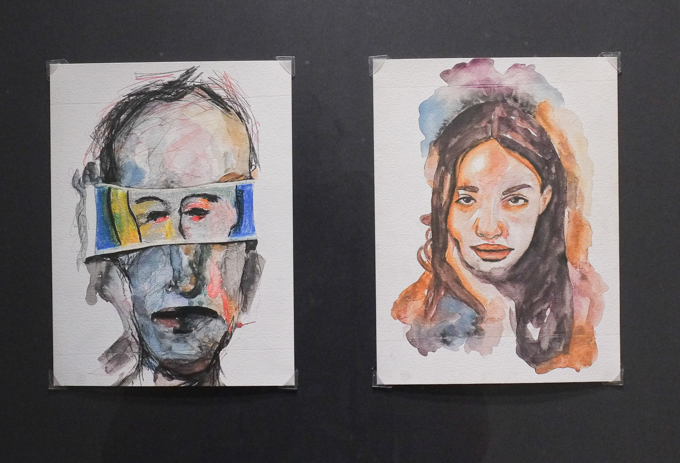
below: Isabel M. Martínez’s exhibition “I Was Thinking About All of This and All the While I Kept Walking Further and Further, in Wider and Wider Circles”. These are prints.
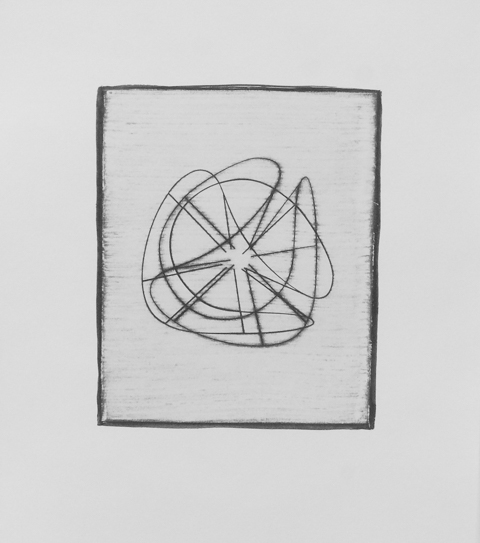
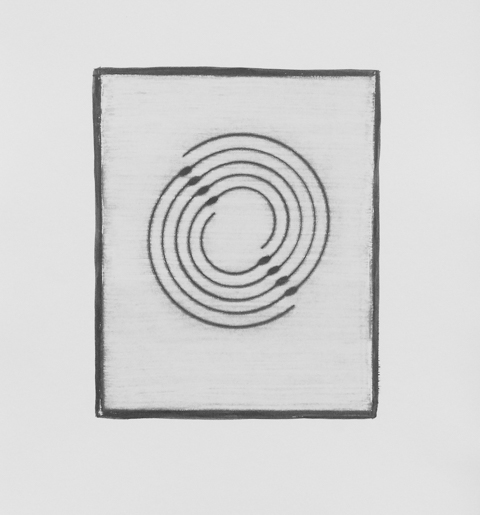
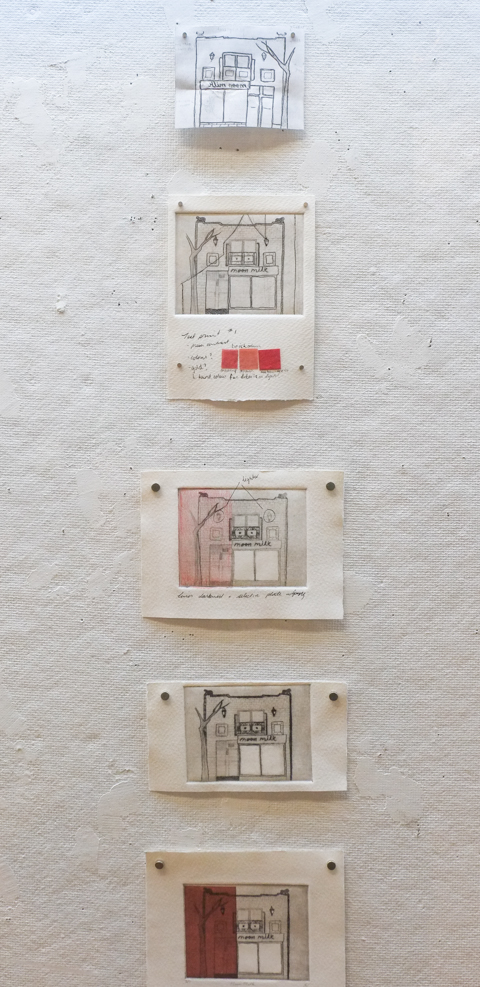
below: Another printmaker has shown some of the steps in the decision making process when developing a print. My apologies to the artist for not noting his/her name.
below: A painting from “Colour of an Object” by Walter Procsa – where colour is the language of emotion and “Contrasting hues are thoughtfully arranged to create both tension and atmosphere” (from the words on the wall of the gallery).
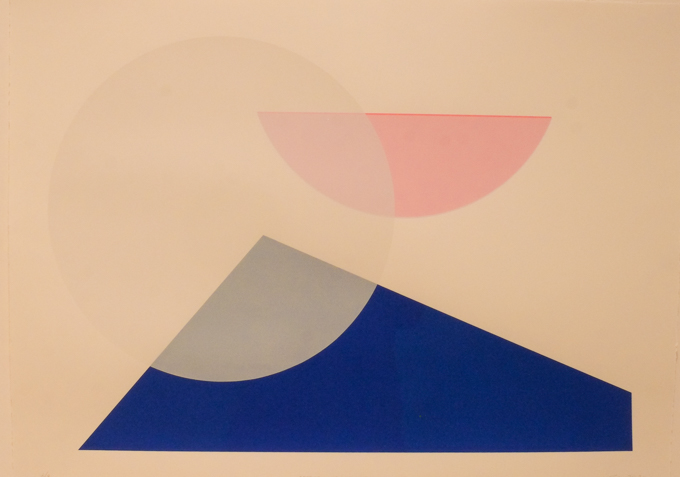
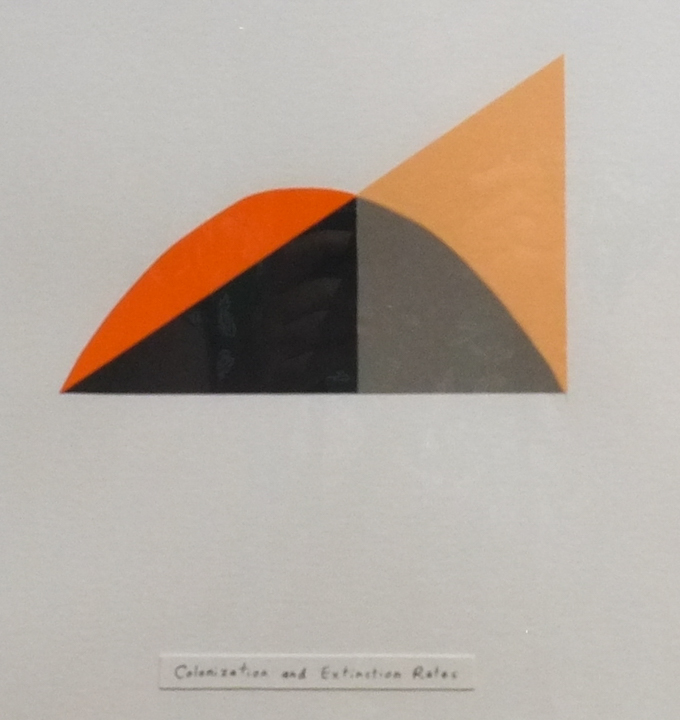
below: A similar look to the painting above is this little diagram. It was achieved in a very different manner if the title, “Colonization and Extinction Rates” is to be believed. Lines produced by graphing a mathematical equation or two. The slope of a straight line is rise/run. If you think that the darker orange shape is a parabola, then any quadratic equation will do.
If the title is “real”, this is piece by Richard Ibhgy and Marilou Lemmens might be a representation of the equilibrium model of island biogeography where the immigration of new species to the island is balanced by the consequent loss of species. The x-axis here is the number of species and the point where the black shape turns grey is the equilibrium point where colonization = extinction. But, and it’s a big but, graphs by other people of the same data aren’t exactly like this one.
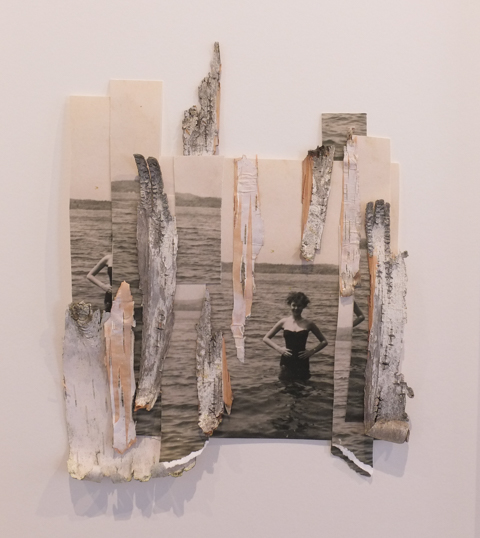
below: Molly Steels, “Within a Surface”, an exhibit that showcases the work that she did during her 6 month artist residency at Gallery 44. Strips of birch bark matched with black and white photos of people in a lake.
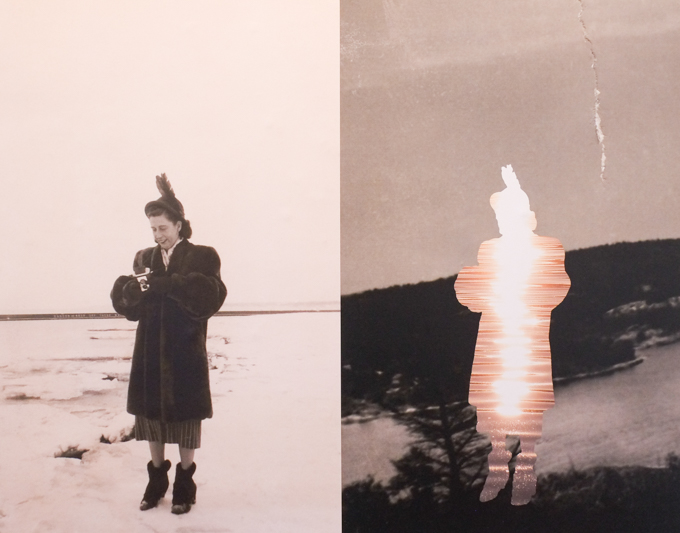
… or paired photos with an element removed on one side that appears in its original form on the other.
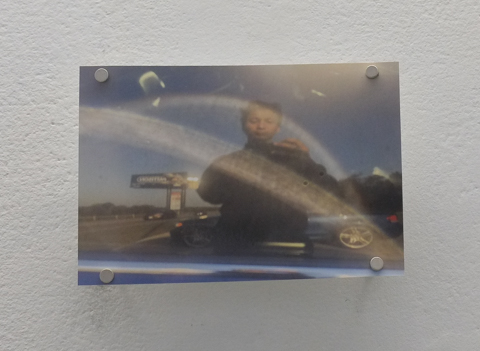
below: One photo from “Cute Paranoias” by Jake Santos – This small photo was displayed surrounded by a lot of white space. It is another Gallery 44 exhibit.
An exhibit of a different kind….